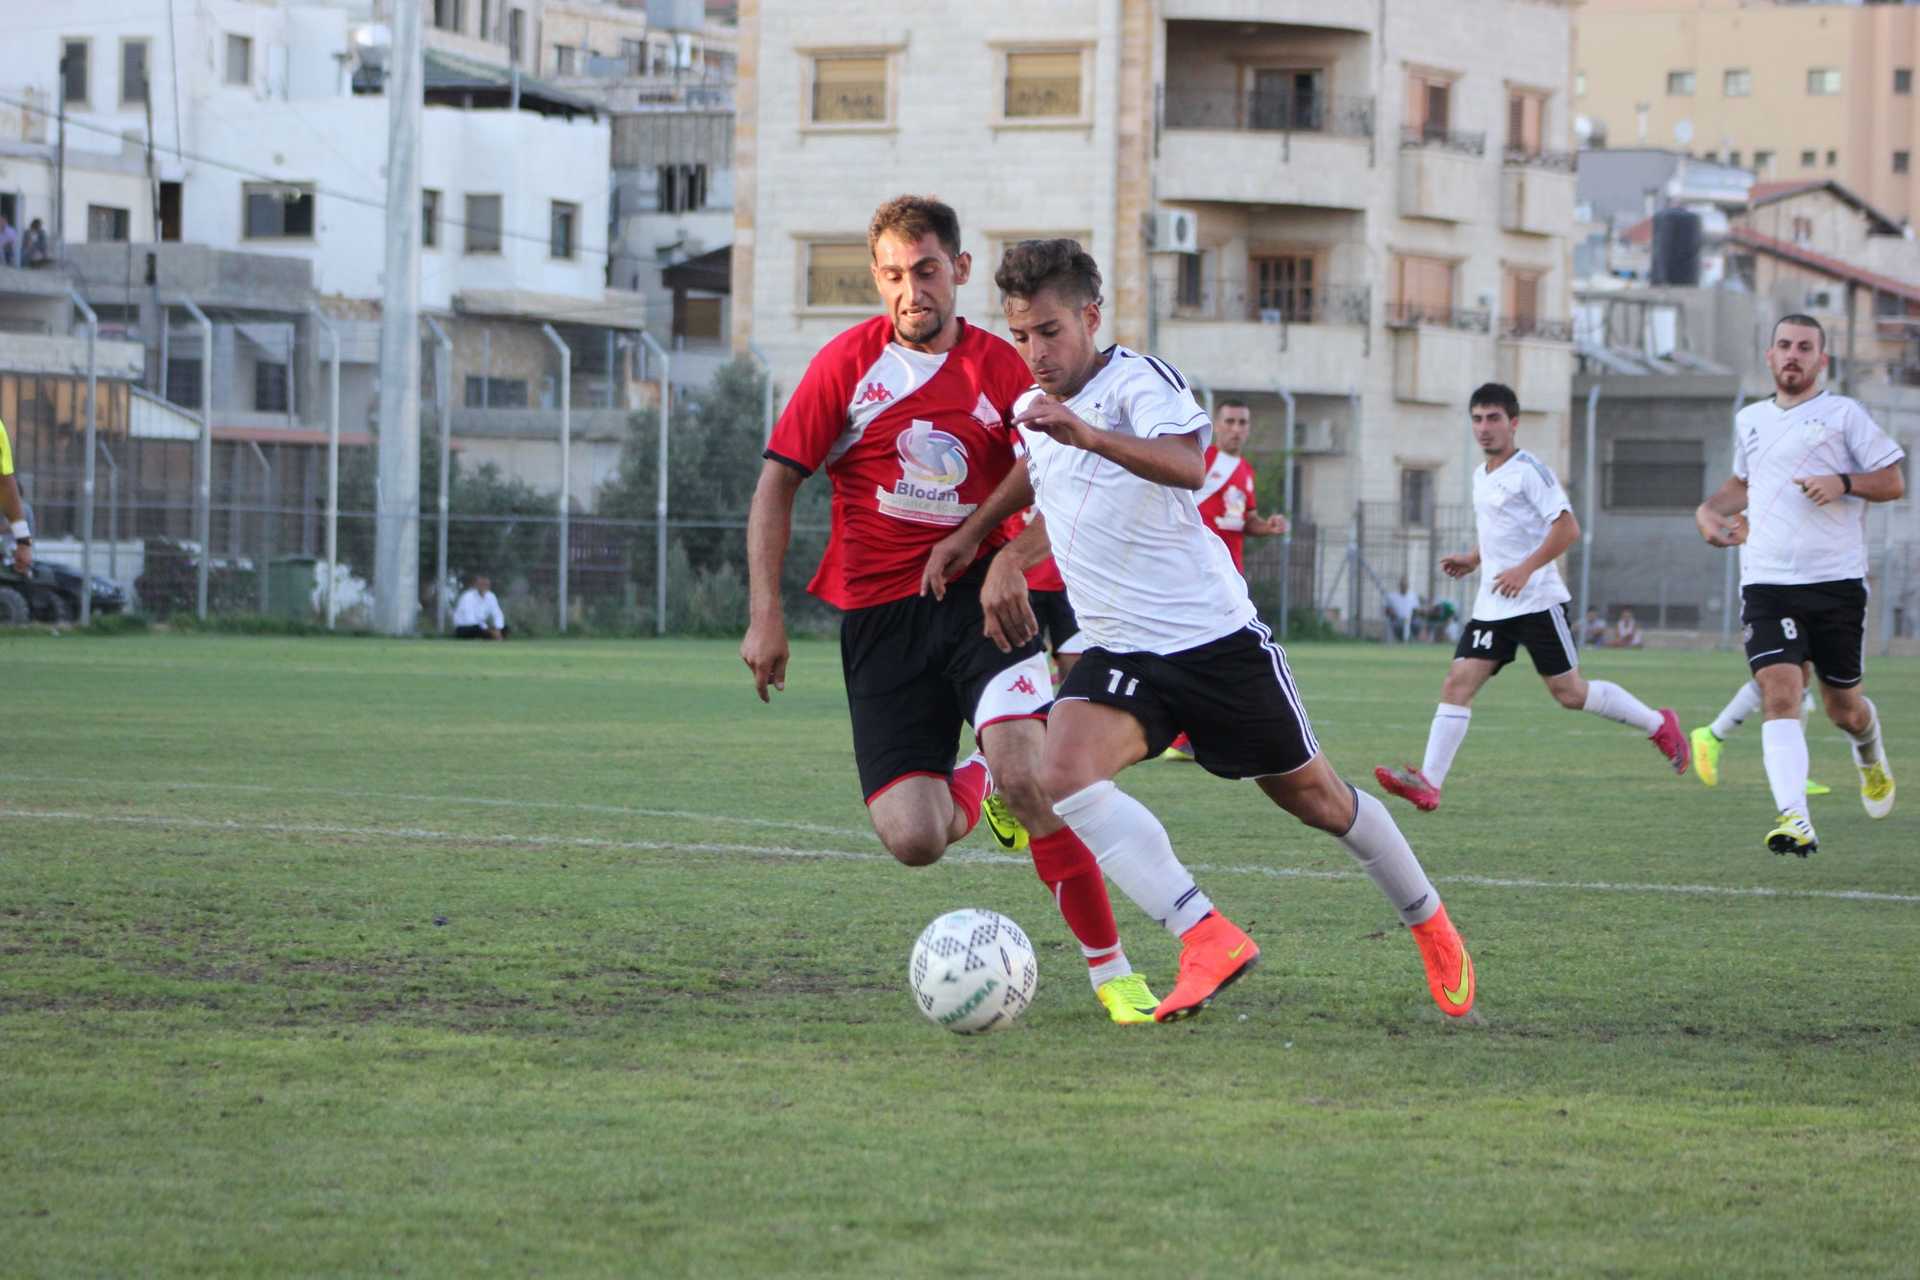
How much does a soccer player run in a game?

Modern GPS technology allows us to collect data on soccer players' running performance, including total distance covered, distance covered at different intensities (i.e speeds), and the number of sprints. Data indicates that elite soccer players will run 6-9 miles (9-14 km) each game, with most of the distance being low to medium intensity and only 10% being high-intensity [3].
Many scientific studies have also concluded that the playing position on the field impacts running performance, with midfielders covering the largest distances, and wingers performing the most sprints. In this article, we will take an in-depth look at various aspects of running performance in soccer.
Positional running patterns
How much do central defenders run?
The average total distance that a central defender will run during a game is 9,313m. Multiple studies have shown that central defenders run the shortest distances when compared with other playing positions, and also perform the least high-intensity movements. This is unsurprising considering the tactical requirements of a central defender. Their main tasks involve tackling, aerial duels, and anticipating/intercepting passes, so running is usually not as much of a requirement when compared to other positions.
How much do fullbacks run?
The average total distance that a fullback will run during a game is 10,368m. Fullbacks are positioned on the outside of the field and have been shown to perform more sprints than those players in central positions. There is a significant disparity between the number of high-intensity runs performed by elite fullbacks compared to fullbacks playing in lower leagues. This enforces the idea that sprint distance is a very important running variable for becoming a top-class fullback.
How much do central midfielders run?
The average total distance that a central midfielder will run during a game is 11,155m. The central midfielder is proven to run more than any other position on the pitch. A central midfield player will also cover significantly more distance while jogging (4,600m) and while running (1,675m). The reason that a central defender will run more than all other positions is due to their tactical requirements, which involve connecting the defense to the attack, which naturally allows them to cover more distance.
How much do wingers run?
The average distance that a winger will run during a game is 10,265m. Although wingers do not cover as much total distance as central midfielders, or fullbacks, they are shown to cover the greatest distances at high speed, sprinting, and have the most high-intensity accelerations. They also cover the least distance while walking. This is unsurprising, as the main role of a winger is to dribble past opposing defenders and try to get crosses into the penalty area.
How much do forwards run?
The average distance that a forward will run during a game is 9,797m. Forwards show a high amount of high-intensity accelerations and sprints, but also spend the most time walking, and cover less overall distance when compared to most other positions. This is because forwards are mainly focused on explosive movements in a smaller area of the field.
Do winning teams run more?
It is often suggested that the most successful teams are the teams that work the hardest and run the most. But is this scientifically accurate?
"Overall technical and tactical effectiveness of the team rather than high levels of physical performance per se are more important in determining success in soccer. "
Data suggests that the total distance covered during a game is not directly related to improved performance, however, the intensity of the running does seem to have a direct correlation. A study of the top-level European leagues found that 10% of the total running time was performed at a high intensity (running speeds of 12.3 m/h (19.8 km/h) and above). However, in the lower-quality leagues, the high-intensity running time is significantly lower, at around 6 % [1].
- All positions
- Central Defenders
- Fullbacks
- Central Midfielders
- Wingers
- Forwards
Definition of different speeds
- Walking
- < 4.4 m/h (7.1 km/h)
- Jogging
- 4.5-8.9 m/h (7.2-14.3 km/h)
- Running
- 9-12.2 m/h (14.4-19.7 km/h)
- High-speed running
- 12.3-15.6 m/h (19.8-25.1 km/h)
- Sprinting
- > 15.6 m/h (25.2 km/h)
- High-intensity accelerations
- > 3 m/s2
Central defenders
There appears to be a higher correlation between high-intensity running and improved performance when looking specifically at the center back position. If the central defenders are entering duels and pressing opponents with higher intensity and aggression. they are more likely to win the duels and subsequently increase the probability of winning the game.
Fullbacks
The data for fullbacks suggest that the number of decelerations is the running variable that affects performance the most. The fullback has defensive tactical duties in their own half, as well as offensive duties in their opponent's half. The evidence suggests that if a fullback has a higher number of stoppings (decelerations), then it will have a negative impact on their ability to join in with the attacking plays. This suggests that a more fluid running style that is more important for a fullback than the total distance covered.
Central midfielders
Surprisingly, there does not seem to be a significant statistical correlation between the running performance of central midfielders and a positive game outcome. This suggests that other variables are more significant for the overall performance of the central midfielder. These variables could include keeping possession, key passes, tackles and shots.
Forwards
The most important running variable for forwards appears to be sprinting distance. There is a high correlation between sprint distance during a game and the likelihood of a positive game outcome. The forwards spend most of the game near the opponent's goal, so every high-intensity sprint is an opportunity to create an attacking situation.
The data indicates that there are significant differences between playing positions with regard to all aspects of running performance. The greatest differences are in the distance covered whilst running, and the total distance covered, with central midfielders running the greatest distances, and central defenders running the least. The least variation is found in the distance covered while walking, suggesting that all positions will walk roughly the same distance during a game.
Does the formation affect running distances?
The team's formation does appear to affect the running patterns during a game. One scientific study [4], tested some of the most common formations (4-4-2, 4-3-3, 3-5-2, 3-4-3, and 4-2-3-1) in elite soccer games. The study concluded that the 3-5-2 formation resulted in a greater total distance run by the players, and more high-speed running when compared to other formations. The 4-2-3-1 formation resulted in the greatest number of accelerations and decelerations.
From a positional point of view, the central midfielders ran 11% more when playing in a 4-3-3 formation compared to a 4-4-2 formation. Forwards playing in a 3-5-2 formation had an incredible 45% more high-speed running and 49% more accelerations than when playing in a 4-2-3-1 formation.
Do players run more in the first half?
A study has found that the distance covered by soccer players in the first half of a game was 12.6% greater than the distance covered in the second half [3]. The reduction in running during the second half occurs at all speed levels. There was a 15% decrease in jogging distance, a 19.5% decrease in running distance, and a 16.9% decrease in high-speed running.
- First half
- Second half
Which players have run the furthest during a soccer game?
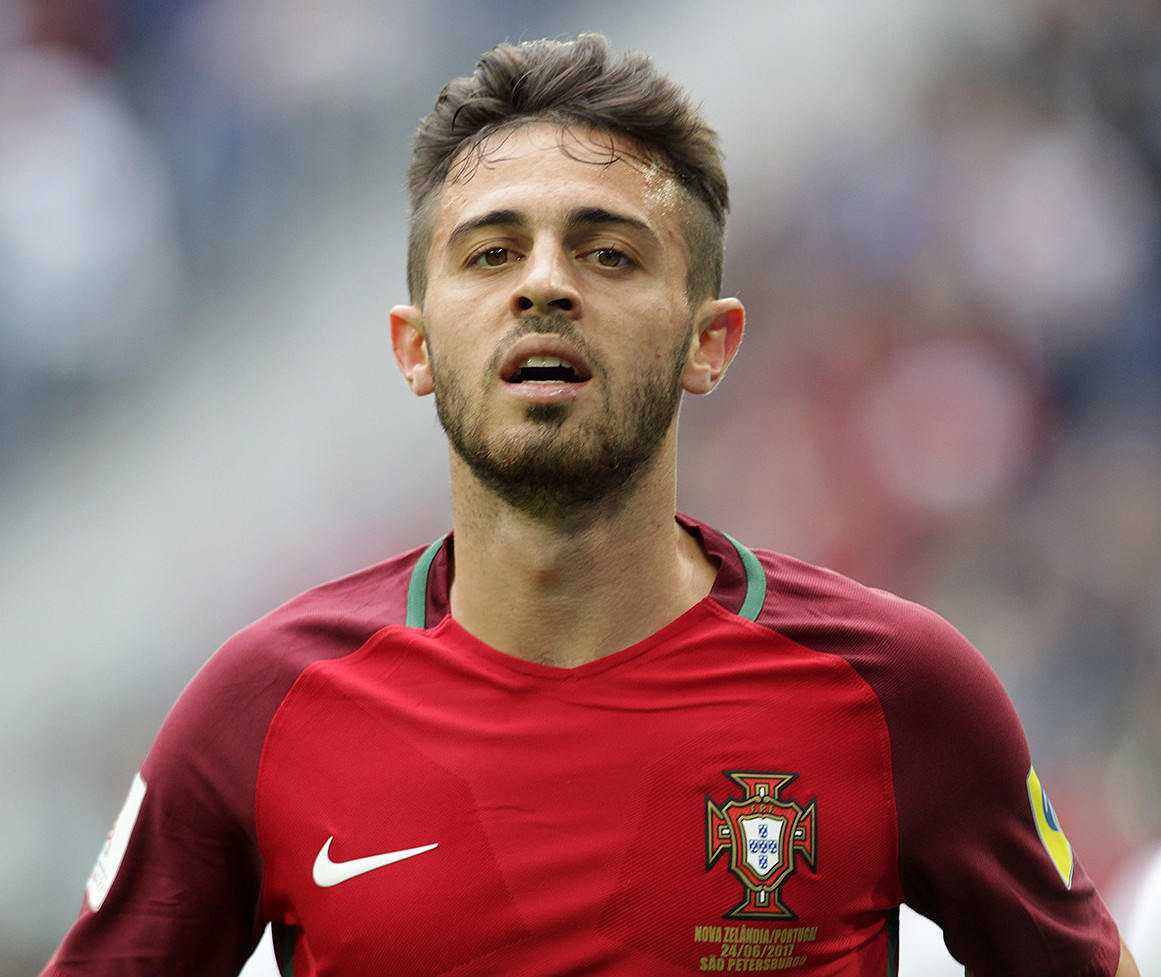
During the 2018/19 Premier League season, Manchester City's Bernardo Silva ran an incredible 13.7 km (8.51 m) during the 90 minutes against Liverpool, which broke his previous record of 13.65 km (8.48 m) in the same season.

Bernardo Silva covers some of the greatest distances during soccer games | Кирилл Венедиктов , CC BY-SA 3.0 GFDL, via Wikimedia Commons
James Milner is also known to be an incredibly hard worker for the team, and he ran an impressive 13.56km (8.42 m) during the 2015 Premier League season, in a 4-1 victory over Stoke.
How far do soccer players run compared to other sports?
Soccer players, on average, will run further than other ball-playing sports. However, this does not necessarily mean that they have superior fitness. It is difficult to make direct comparisons due to a number of factors. Soccer is played at a wide range of intensities, and can include periods of walking. When compared to a sport like basketball, it is rare for a player to be walking, and the majority of the game is spent sprinting, with many accelerations and decelerations. The duration of a game will also vary between different sports, so it is logical that a longer game will involve more running.
| Sport | Average Distance (miles) |
|---|---|
| Soccer | 7 |
| Field hockey | 5.6 |
| Rugby | 3.7 |
| Tennis | 3 |
| Basketball | 2.5 |
| Football (wide receiver) | 1.2 |
| Baseball | 0.0375 |
References
- Modric T, Versic S, Sekulic D, Liposek S. Analysis of the Association between Running Performance and Game Performance Indicators in Professional Soccer Players. Int J Environ Res Public Health. 2019 Oct 21;16(20):4032. doi: 10.3390/ijerph16204032. PMID: 31640271; PMCID: PMC6843975.
- Di Salvo V, Gregson W, Atkinson G, Tordoff P, Drust B. Analysis of high intensity activity in Premier League soccer. Int J Sports Med. 2009 Mar;30(3):205-12. doi: 10.1055/s-0028-1105950. Epub 2009 Feb 12. PMID: 19214939.
- Metaxas, Thomas. (2018). Match Running Performance of Elite Soccer Players: V[Combining Dot Above]O2max and Players Position Influences. Journal of Strength and Conditioning Research. 35. 1. 10.1519/JSC.0000000000002646.
- Tierney, P. J., Young, A., Clarke, N. D., & Duncan, M. J. (2016). Match play demands of 11 versus 11 professional football using Global Positioning System tracking: Variations across common playing formations. Human movement science, 49, 1–8. https://doi.org/10.1016/j.humov.2016.05.007